PSL
PSL Stats Leaderboard: 10 stats from the PSL season
Who tops the stats in the PSL season so far – Part 2 (Teams)

We are at the back end of the final international break of 2025. As usual, the break gives us a chance to breathe and take stock of what the season has given us behind the scenes. With nearly 100 matches played in the league season, now is a perfect time to check in the leaderboards when it comes to some of the stats. We’ve selected 10 stats to help review the campaign so far, with five team stats (Part 2), having covered five player stats last week. Enjoy.
Teams with the highest rates of ball possession this season
For the umpteenth season in recent memory, Sundowns are the most possession-heavy team in the division. Not only is high possession a part of the Sundowns’ style of play, it is largely part of their culture – irrespective of the coach in charge. For the sixth straight season, Sundowns lead the possession charts.
Top five teams for ball possession this season:
- 72% – Sundowns
- 60% – Kaizer Chiefs
- 57% – Orlando Pirates
- 54% – Sekhukhune Utd
- 51% – Stellenbosch FC
- League average possession: 50%
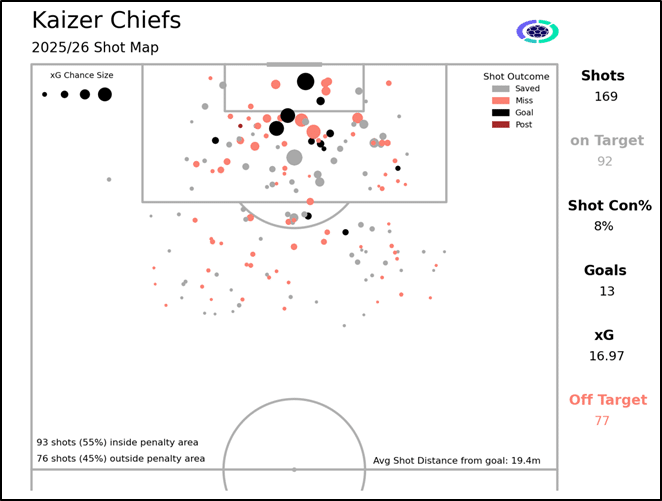
Most shots taken by a team
Kaizer Chiefs are the team that have been eager to pull the trigger more often than any team this season. Averaging 15.4 shots per game, the Glamour Boys may be disappointed by their short conversion that has yielded just 13 goals, which is the sixth highest.
Top 5 teams for shots taken this season (shot conversion rate in brackets):
- 169 – Kaizer Chiefs (8% conversion rate)
- 152 – Sundowns (13%)
- 145 – Polokwane City (6%)
- 143 – Sekhukhune Utd (10%)
- 134 – Durban City (8%)
- League average conversion rate: 9%

Most big chances created by a team
Raw shot volumes do not give a full picture of a team’s attacking performance. By definition, big chances are a better indicator of teams’ attacking abilities – these are situations where players are reasonably expected to score, usually one-on-one scenarios created by the team, or very close range shots when the ball has a clear path to goal & there is low to moderate pressure on the shooter.
Top 5 teams for big chances created this season (big chance conversion rate in brackets):
- 22 – AmaZulu (38% conversion rate)
- 22 – TS Galaxy (26%)
- 20 – Magesi (24%)
- 19 – Orlando Pirates (25%)
- 18 – Golden Arrows (58%)
- 18 – Siwelele (27%)
- League average conversion rate: 36%
Most times a team has hit the woodwork
Some teams will consider themselves unfortunate to have done everything to beat the goalkeeper with their shots, yet fail to beat the frame of the goal. Altogether, the woodwork has been struck 49 times this season – we’d have 49 more goals if the shots were on the correct side of the frame by just 10cm.
Top 3 teams for hitting the woodwork this season:
- 5 times – Marumo Gallants
- 5 – Orlando Pirates
- 5 – Sekhukhune Utd
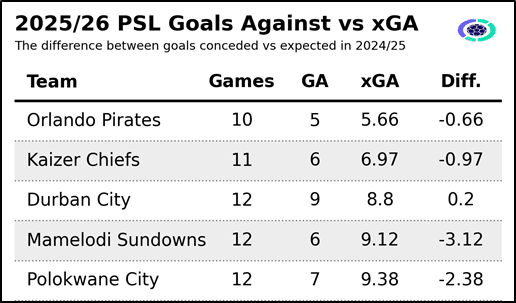
Best defences in the league
While attacking metrics create the most excitement among fans, defensive metrics are just as important. Goals conceded and clean sheets are usually the chosen metrics to gauge defensive abilities, but they fall short for many reasons. Expected Goals (xG) is a better metric – it measures the quality of a shot based on several variables such as assist type, shot angle, distance from goal etc. Adding up a team’s expected goals against can give us an indication of how many goals they should have conceded on average, given the shots they have allowed the opposition.
Top 5 teams with the best Expected Goals Against (xGA):